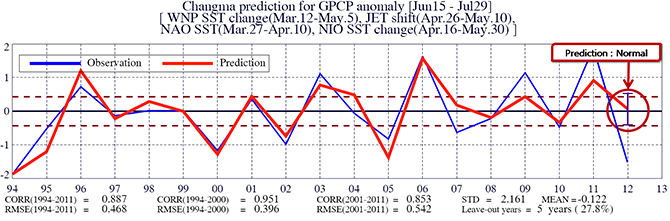
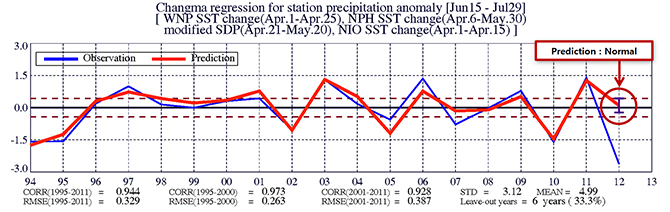
The statistical prediction model for Changma period (The prediction will be updated around mid-May every year.).The above two figures show the observed and predicted precipitation time series. A GPCP anomaly index is averaged over the Korean peninsula and its vicinity [123.75°-131.25°E, 33.75°-38.75°N]. For station precipitation anomaly index, an average of 60 observation station data are used. The both indices are constructed for the major Changma period from June 15 to July 29. For the empirical prediction, a linear regression and a cross-validation method are applied. The four predictors are selected in the GPCP model: Western North Pacific (WNP) SST change, Jet stream shift (JET shift), North Atlantic Oscillation (NAO), North Indian Ocean (NIO) SST change with 5 leave-out cross-validation method. For the station precipitation model uses WNP SST change, North Pacific (NP) SST change, modified subtropical dipole pattern (SDP) and NIO SST change with 6 leave-out cross-validation method. The time series in the figures are normalized using mean and standard deviation of the GPCP and the station precipitation anomaly indices.
<< The Four Predictors for the GPCP model >>
WNP SST change = SST anomaly change [110°-130°E, EQ-20°N]
North Atlantic Oscillation = SST anomaly [40°-30°W, 45°-50°N]-[80°-60°W, 30°-45°N]
Jet stream shift = U200 anomaly [110°-140E°,42.5°-47.5°N]-[120°-140°E,30°-40°N]
North Indian Ocean SST change = SST anomaly change [60°-100°E, EQ-20°N]
<< The Four Predictors for the station precipitation model >>
WNP SST change = SST anomaly change [110°-130°E, EQ-20°N]
North Pacific SST change = SST anomaly change [150°-180°E, 20°-40°N]
Modified subtropical dipole parrtern = SST anomaly [40°-70°E, 30°-20°S]-[70°-100°E, 25°-15°S]
North Indian Ocean SST change = SST anomaly change [60°-100°E, EQ-20°N]
<< TThe statistical prediction model >>
GPCP anomaly = -0.09 + 0.245*WNP SST change + 0.130*JET shift
- 0.708*NAO + 0.479*NIO SST change
Station precipitation anomaly = -0.017 - 0.210*WNP SST change + 0.719*NP SST change
+ 0.549*modified SDP + 0.234*NIO SST change
-GPCP data
Correlation = 0.507 , RMSE = 0.869
-Station precipitation data in Korea
Correlation = 0.695 , RMSE = 0.712