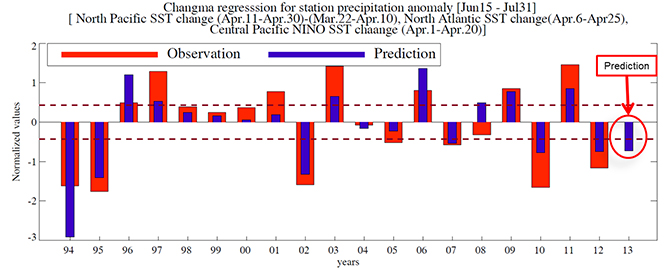
The statistical prediction model for Changma period (The prediction will be updated around mid-May every year.).The above figure shows the observed and predicted precipitation time series. For station precipitation anomaly index, an average of 45 observation station data are used. The index is constructed for the major Changma period from June 15 to July 31. For the empirical prediction, a linear regression and a cross-validation method are applied. For the station precipitation model uses North Pacific (NP) SST change, North Atlantic (NA) SST change, Central Pacific NINO SST change with 4 leave-out cross-validation method. The time series in the figures are normalized using mean and standard deviation of the station precipitation anomaly index.
<< The Three Predictors for the station precipitation model >>
Nrothern Pacific SST change = SST anomaly change [160°-210°E, 20°-35°N]
North Atlantic SST change = SST anomaly [40°-15°W, 55°-60°N]-[80°-40°W, 30°-45°N]
Central Pacific NINO SST change = SST anomaly change [160°-140°W, 15°S-10°N]
<< The statistical prediction model >>
Station precipitation anomaly = + 0.458 * [NPC] + 0.413 * [NA] - 0.396 * [CNINO]
Correlation = 0.843 , RMSE = 0.550 , GMSS = 0.815