East Asian Summer Monsoon Index (EASMI)
The EASM index data
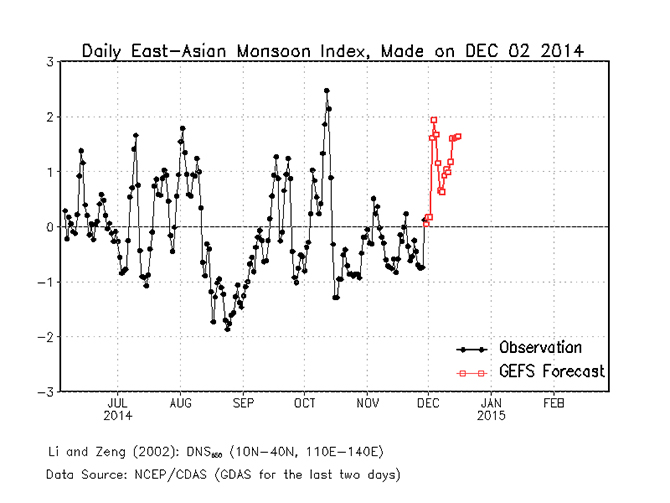
The East Asian Summer Monsoon Index (EASMI)

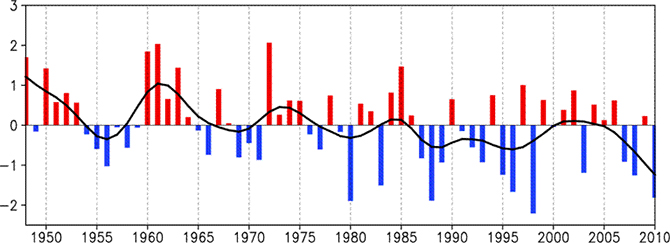
The normalized time series of EASMI for the period of 1948-2010.
The summer here is JJA. The thick solid lines indicate 9-year Gaussian-type filtered values.

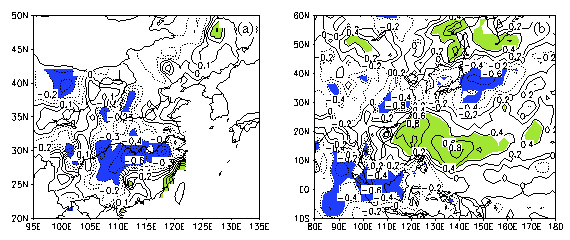
Correlation maps between the EASMI and summer (JJA) rainfall over (a) China (1958-99) and (b) the East Asian (1977-97). The shaded areas indicate significant at the 95% confidence level.


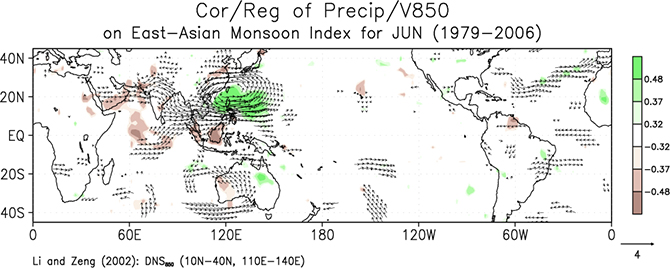
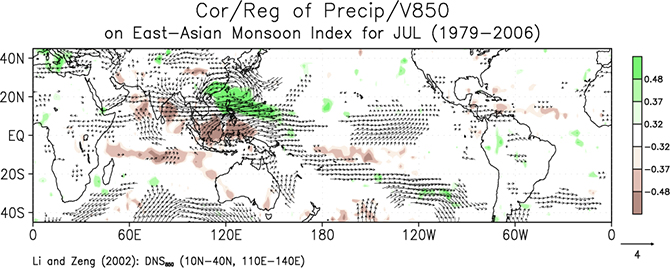
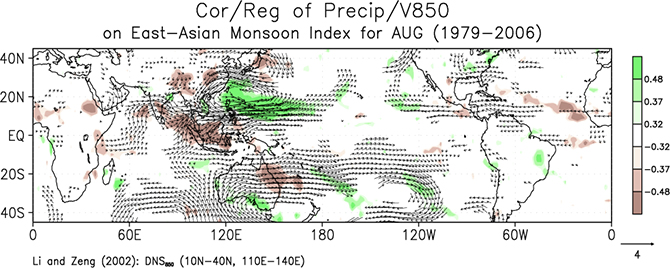
Correlation between precipitation and the EASMI (shading) and regression of 850-mb winds against the monsoon index (vectors) for June, July, and August from 1979 to 2006, respectively. The shaded areas and vectors indicate significant at the 95% confidence level.
Related References
- Li, J. and Q. Zeng, 2005: A new monsoon index, its interannual variability and relation with monsoon precipitation. Climatic and Environmental Research, 10(3): 351-365. Electronic version PDF
- Li, J. and Q. Zeng, 2003: A new monsoon index and the geographical distribution of the global monsoons, Adv. Atmos. Sci., 20, 299-302. Electronic version PDF
- Li, J. and Q. Zeng, 2002: A unified monsoon index, Geophysical Research Letters, 29(8), 1274, doi:10.1029/2001GL013874. Electronic version PDF
The Monthly East Asian Summer Monsoon Index (EASMI) Data |
||
|---|---|---|
Filename |
Size |
Description |
4 kilobytes |
East Asian Summer Monsoon Index (EASMI) |
|
You can download this file from here (right-click then select "Save Target As" or "Save Link As"). |
||
File format |
|---|
for year = 1948 to 2010 format (1x, i4, 8f7.3) year, Jun, Jul, Aug, and summer (JJA) raw values, Jun, Jul, Aug, and summer (JJA) normalized values |
Note:Missing values represented by 99.99. |
CAD Lab